Many people believe they are investing, when in fact they are GAMBLING! People often buy whatever their neighbors buy, they invest like they buy clothes. This is dangerous and unnecessary.
At Mullaney Trust, we have developed a solution to this problem with our risk analysis software: The Mullaney Safety Indicator (MSI)
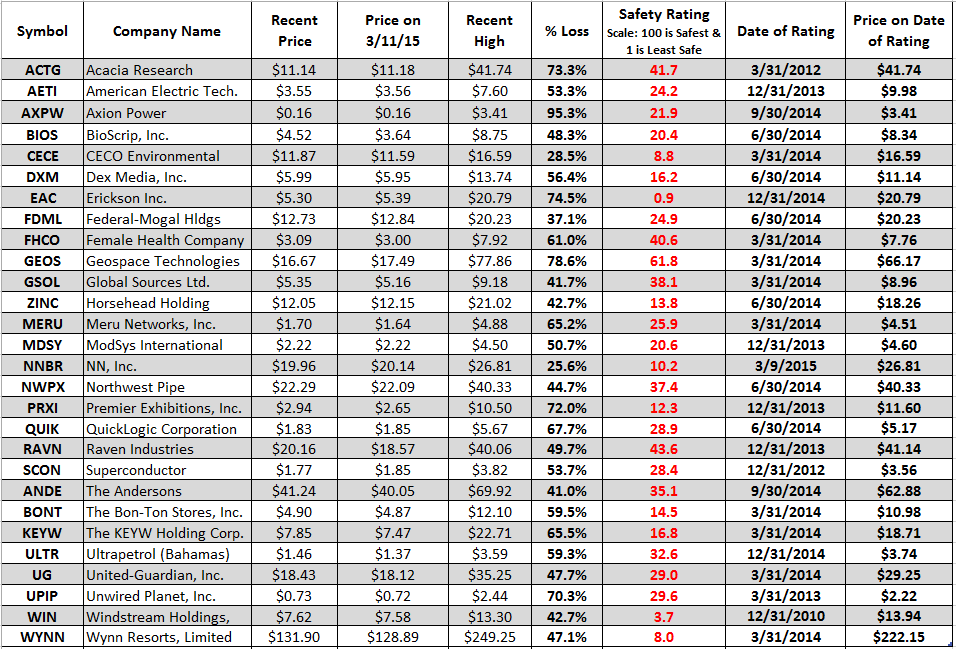
Below you’ll find our ratings for stocks that were once at very high prices that are now much lower. Our system evaluates the solvency, liquidity and minimum net value, assuming no future earnings, of the companies that we follow. Then we evaluate the risks of a company relative to its market capitalization.
Naturally there’s more to it than this. Call me and I’ll be happy to show you what we do and how we arrived at our safety ratings for stocks.
Thanks,
Ray Mullaney
March 10, 2015: Mullaney Research has developed a system of ranking stocks based on their many financial risks. Our system does not forecast price changes. It does, however, rate stocks for their safety and risks; 100, being the safest, and 1 being the least safe stock. This list of companies has recently had significant price declines. In each case, these companies, averaging declines of 55.4% had very high risks ratings, with the average rating of just under 25. How do your stocks rate?

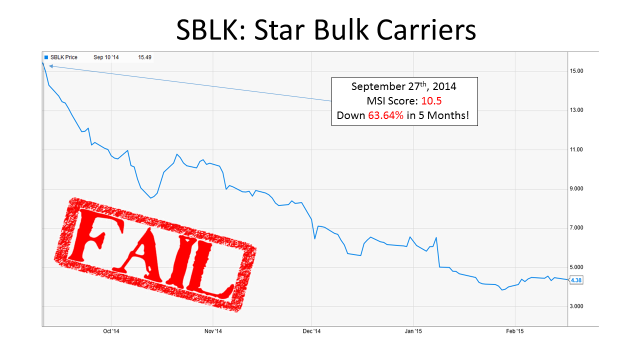
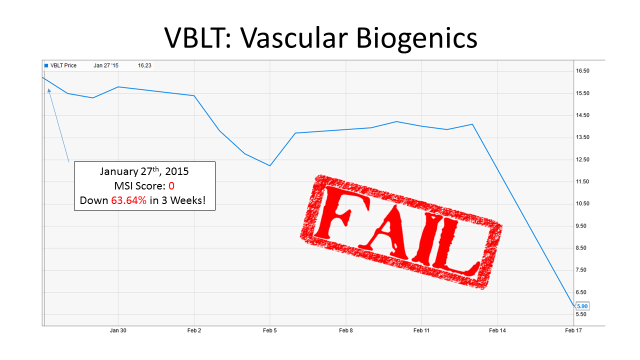
The stocks below have recently been in decline. In these graphs, we are showing you the Mullaney Safety Indicator rating at the local high. The MSI rating distinctly shows how risky these stocks were at these highs. While we cannot forecast how much they could fall, we can clearly indicate the risk involved. Remember, the MSI operates on a scale of 0-100 with 100 being the best score an investment could achieve.


To find more examples of when the Mullaney Safety Indicator has been able to find risky stocks before they declined, look in our archives.
